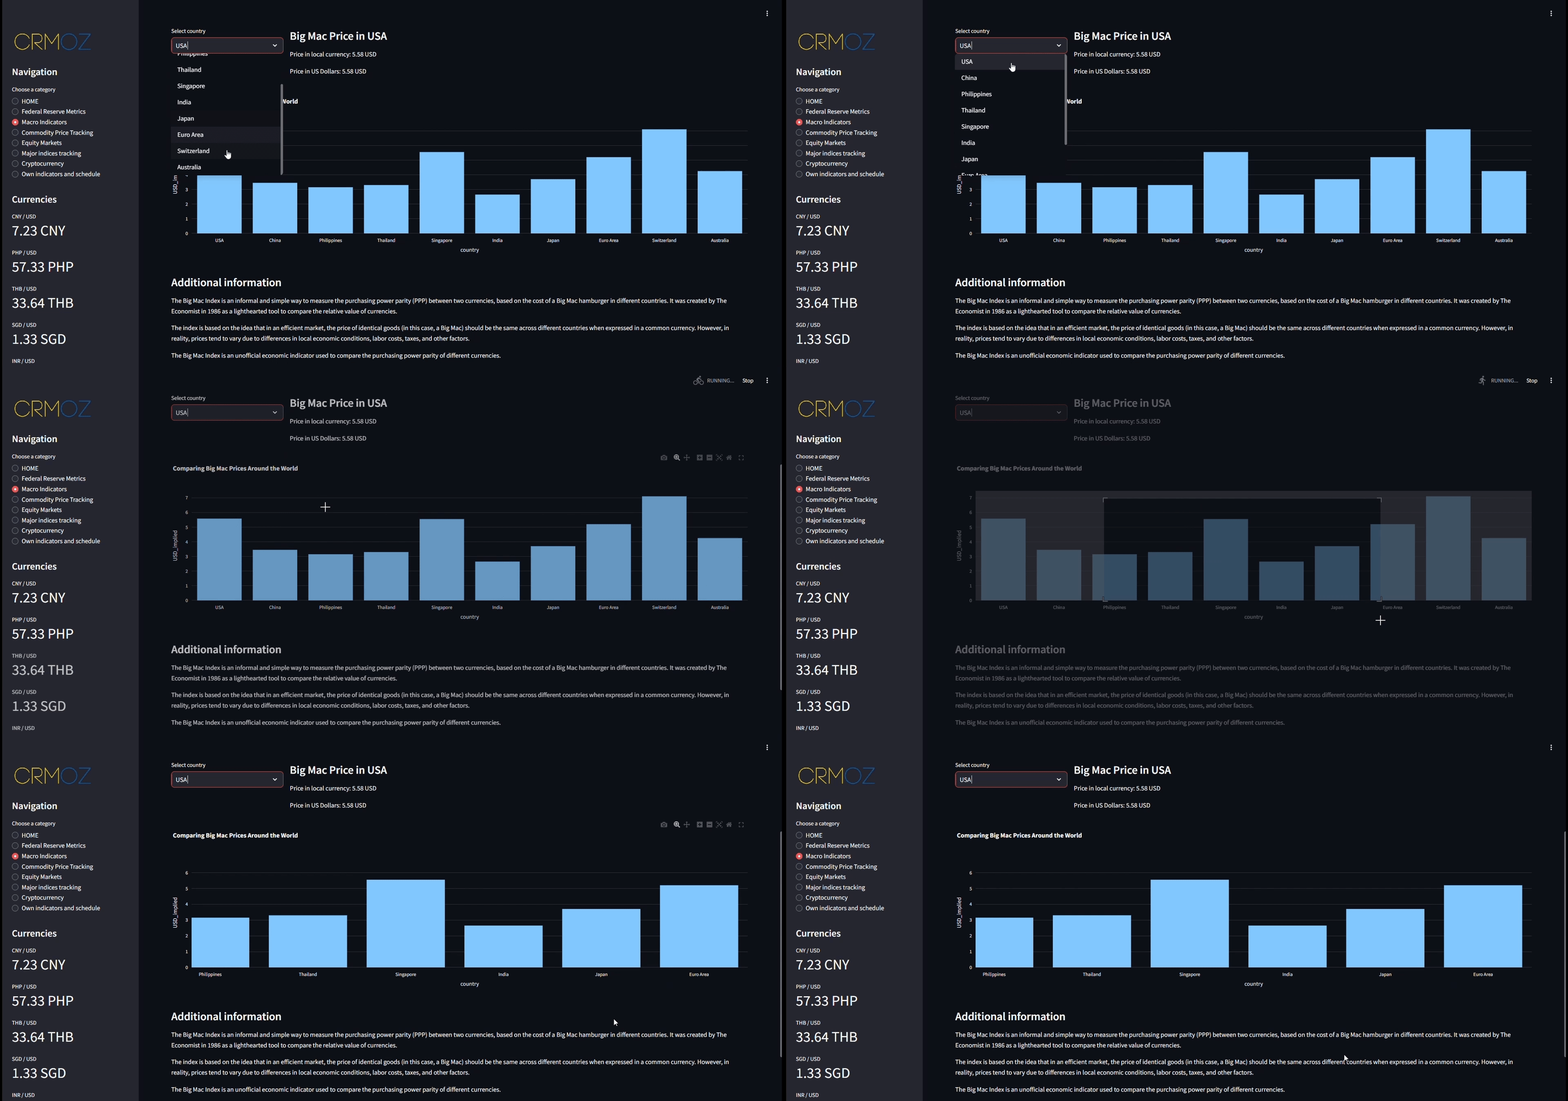
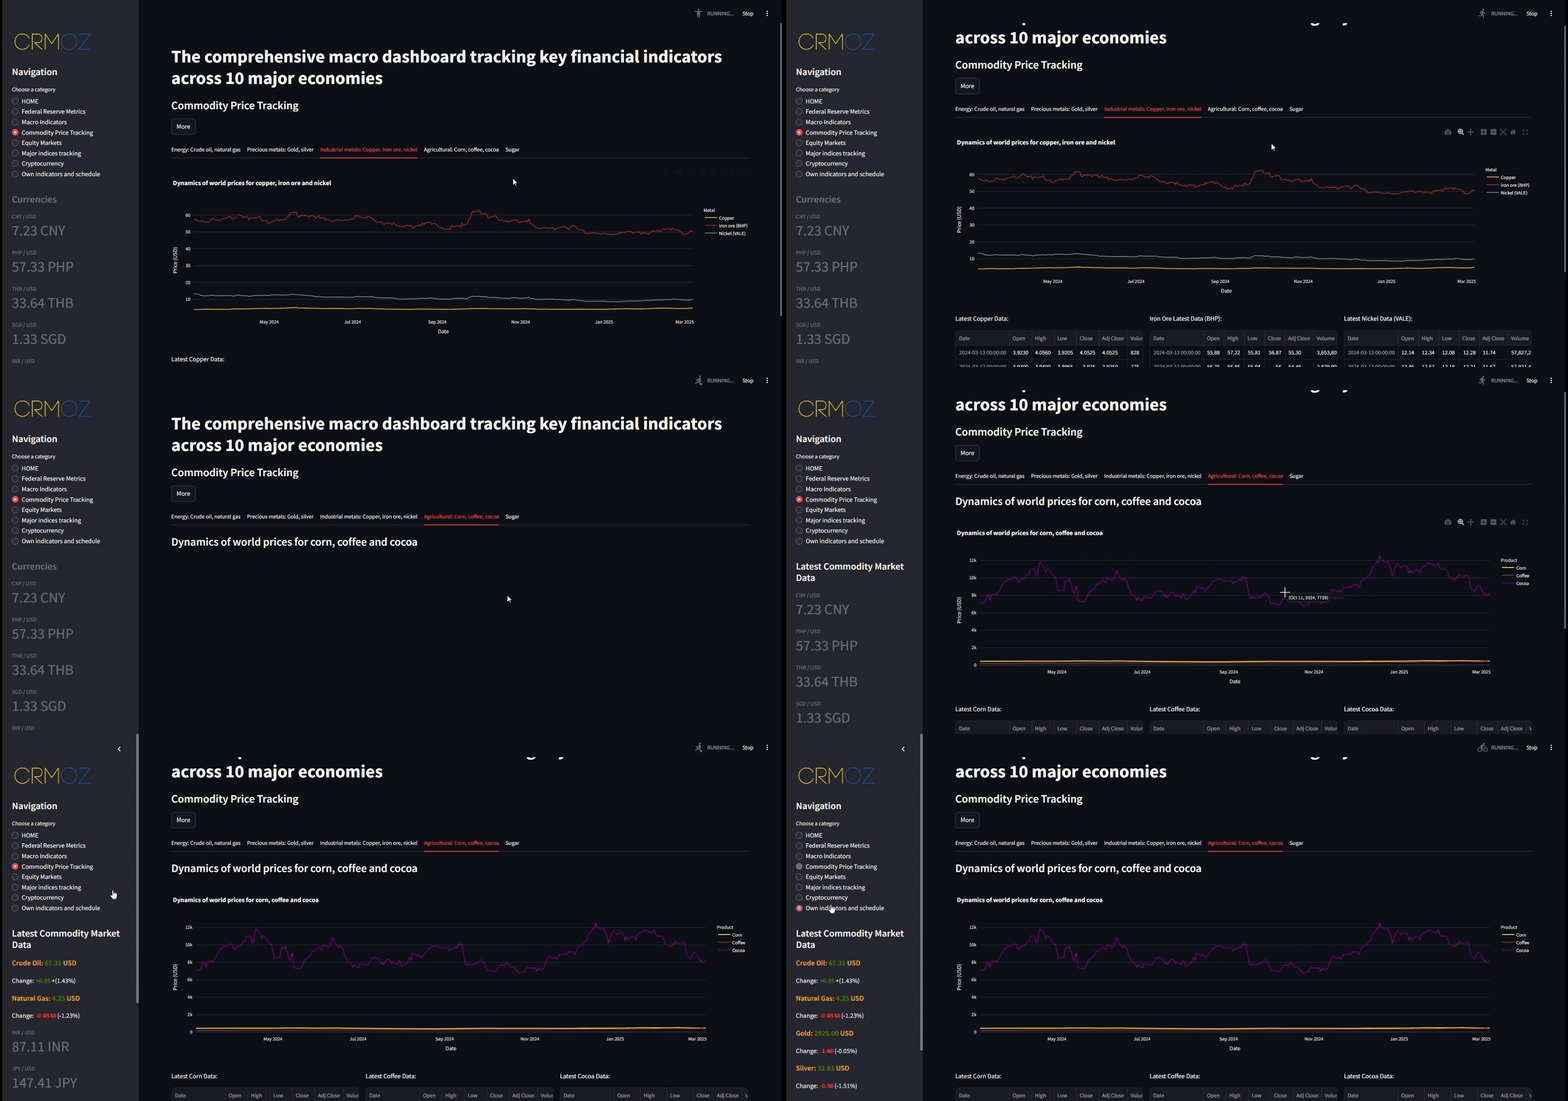
Інтерактивні інформаційні панелі вже тут!
Інтерактивні інформаційні панелі вже тут!

Let's take a look at what makes it special.
A comprehensive analytics for understanding your business
In today's business, hard analytics has become a key element for making informed decisions. It allows you to analyze data from different sources and at all stages of your business process, which allows you to make informed decisions in real time. This is important for any business, because without proper analytics you will not be able to identify opportunities for growth or understand which strategies work best.
📊 Data collection and processing - your ability to combine financial and marketing data from different sources on one dashboard allows you to quickly analyze the effectiveness of your campaigns, identify trends and make decisions on strategies.
🔎 Identification of patterns - with the help of analytics you can see the hidden correlations and see how markets and customer behavior change. This allows you to adjust strategies and get more benefit from each investment.
⚡ Forecasting and optimization - based on the data you will be able to predict when and how to change your actions to maximize results. For example, by using forecasting analytics you will be able to determine the most profitable time for investment.
Потужність аналітики на основі штучного інтелекту
Analyzing financial trends in person takes a lot of time. That is why we have integrated a powerful analytical system based on piece intellect, which helps you to quickly get accurate conclusions from large amounts of data.
📊 In-depth data analysis - our SHI does not just process data, but reveals regularities, which allows us to react to market changes and provide recommendations on strategic moves.
⚡ S peed and accuracy - due to the use of SHI, analytics becomes much faster, which allows you to process data in a few minutes instead of years.
🔒 Bendability and adjustment - you can adjust the system to work both on your own server and for analyzing in the chmari - the choice isyours.

System for maximum comfort
Our panel is not only suitable for viewing data - you can download your own filesExcel, CSV, Google Sheets, MySQL , etc.) and analyze them mittily.
✔️ Customization of graphs, time frames and indicators for your needs.
✔️ Відстеження трендів у реальному часі, з оновленнями кожні 30 секунд.
✔️ Integration with web scraping tools for automatic downloading of up-to-date data.
And since it is based on Python and React, the system is fast, reliable and ready to scale.
Why is it important?
In today's data-driven world, access to the right information at the right time is a game changer. Sophisticated analytics allows businesses to effortlessly analyze trends, find opportunities and make informed decisions - whether you are an investor, an economist or a business owner.
🚀 Want to see it in action? Let's talk about how we can customize this solution for your needs!


