Today, every company from small to large is working to improve productivity by delivering more value to their customers. And business analytics and data analysis, which are the backbone of business today, help with this task. With the help of various tools, you can turn simple numbers into valuable information that will subsequently influence important business decisions.
Data processing, reporting and analysis for most organizations are spreadsheets, especially Microsoft Excel. They have become the de facto tool for both business intelligence and reporting. But there are areas where spreadsheets can be really limited as your business intelligence tool.
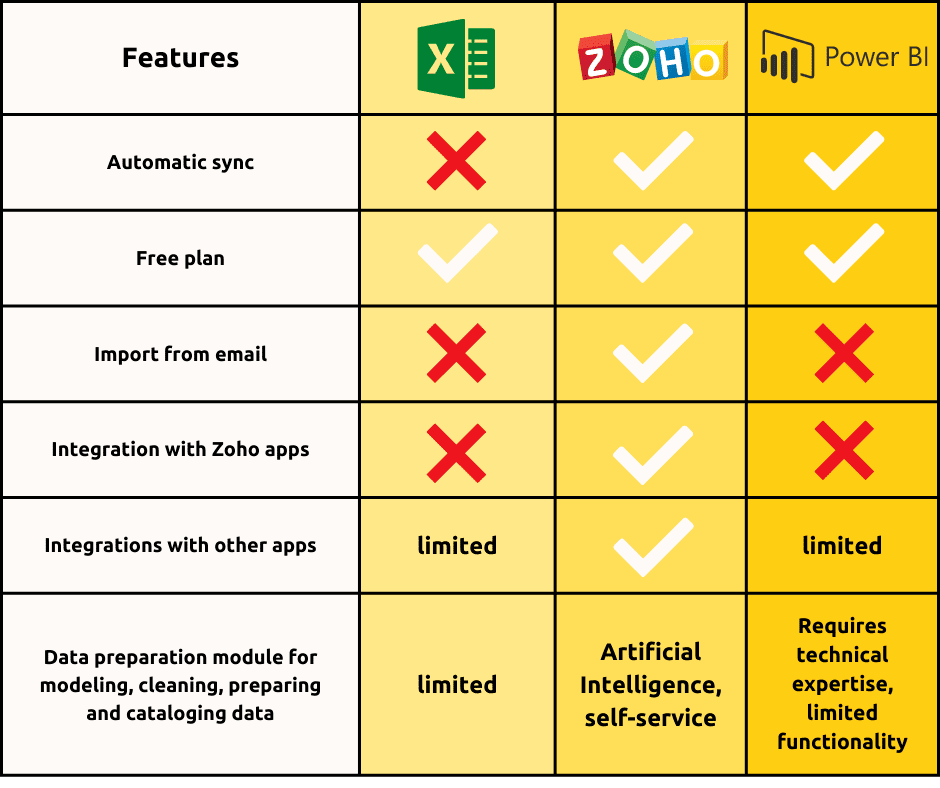
In this article, we will look at some of the pitfalls of Microsoft Excel that you will encounter if you use it as an analytics tool. And we will also present you a detailed comparative study of Microsoft Excel vs. Zoho Analytics and Power BI.
The main disadvantages of Microsoft Excel
- Wide range of data sources: the number of sources from which data can be retrieved is limited. No direct integration with third-party business solutions (CRM, Helpdesk, Finance, etc.), which means you have to either enter data manually or find ways to convert it into a file format that can be downloaded into Microsoft Excel.
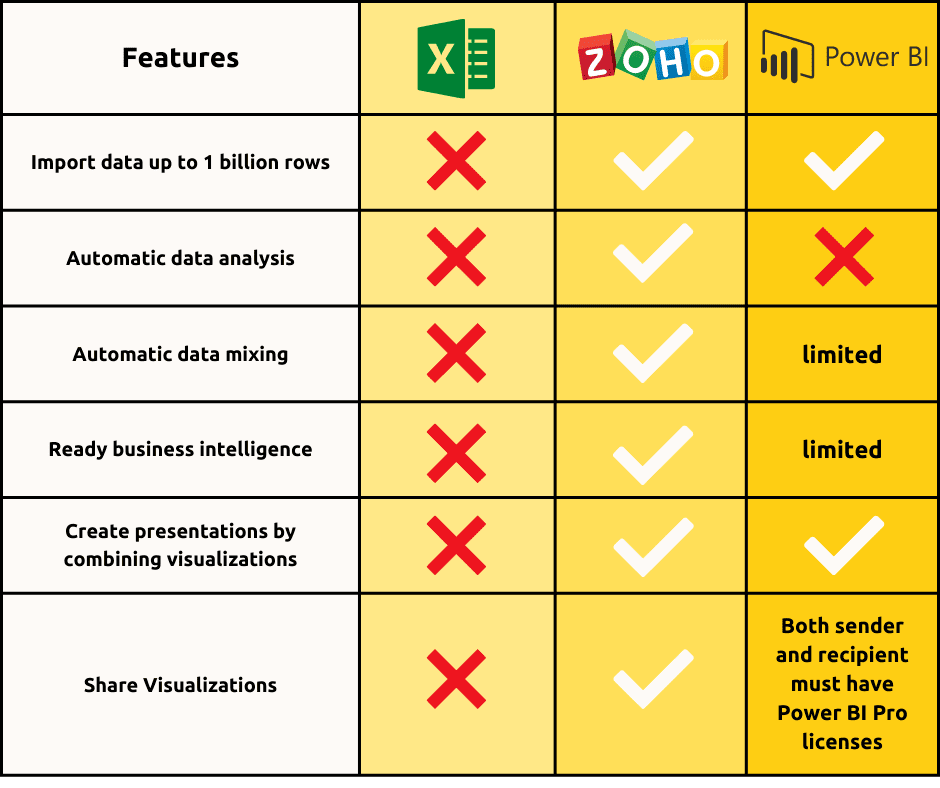
- Big data sets: Business applications generate huge amounts of data that need to be analyzed to make informed decisions. But spreadsheets cannot handle large amounts of data because the maximum number of rows in Microsoft Excel is only 1,048,576. Dealing with large data sets also means slow response times.
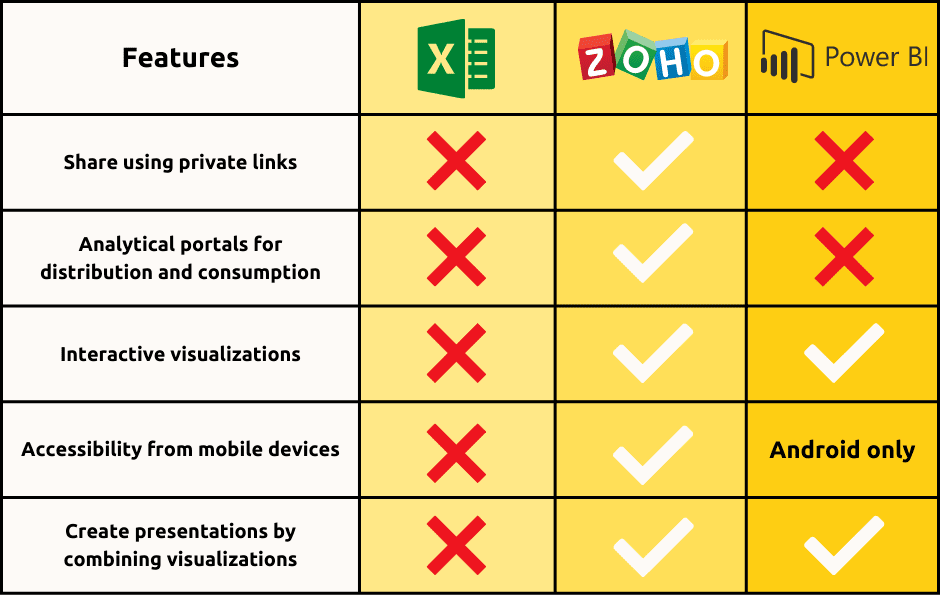
- Visual analysis and exploration: uncovering hidden insights is the ultimate goal of data analysis. With Microsoft Excel, the user must know the end result to be achieved before the analysis even begins. Microsoft Excel does not support automatic analysis. In addition, charts are static. The user cannot interact with the charts, drill down or slice the data. This model will only allow users to create reports that can help them figure out the "what" instead of the "why".
- Collaboration: Once data is shared, it is fully available to the person with whom it was shared. The owner cannot restrict access to a certain data set or certain reports/dashboards. Setting permissions such as read/read-write only, etc. is also impossible. This forces the owner to create multiple copies of the same information to share differently with different users.


Main advantages Zoho Analytics и Power BI
- Connection to various types of data sources and direct integration with popular business applications.
- Handling large data sets: Zoho Analytics and Power BI work quickly and easily handle large amounts of data.
- Visual analysis: allow you to visualize data by creating detailed reports and dashboards using an easy-to-use interface.
- Powerful formula mechanism: allow you to create key performance indicators, get business metrics and conduct in-depth analytics.
- Sharing and Collaboration:Zoho Analytics Allows you to share certain reports/monitoring dashboards with certain users/groups. You can publish and embed reports/ dashboards in your blogs, websites and applications.
- Data integrity: everyone works with the same file with no duplicates.
- Reliability and security: detailed access control allows you to set permissions such as read-only, read-write, etc., guaranteeing the security of your data.
- Analysis on the go: A mobile app means you can access your data/reports/panels no matter where you are.
In conclusion, Microsoft Excel is designed for simple analysis. When it is used in place of a business intelligence tool, it can lead to lost productivity, slower information retrieval times, and human error. It's time to upgrade to a powerful full-fledged business intelligence tool. Go beyond Microsoft Excel, perform in-depth analysis and make data-driven decisions with Zoho Analytics and Power BI.


